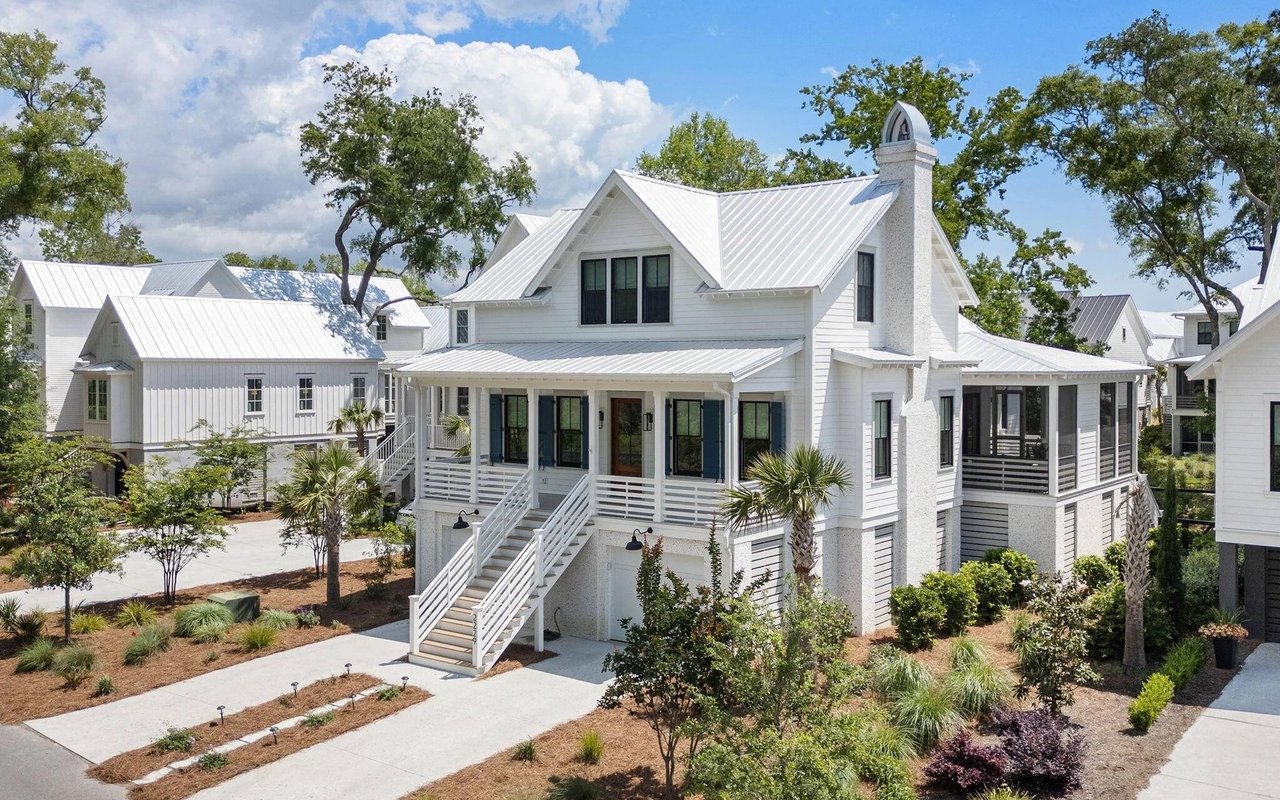
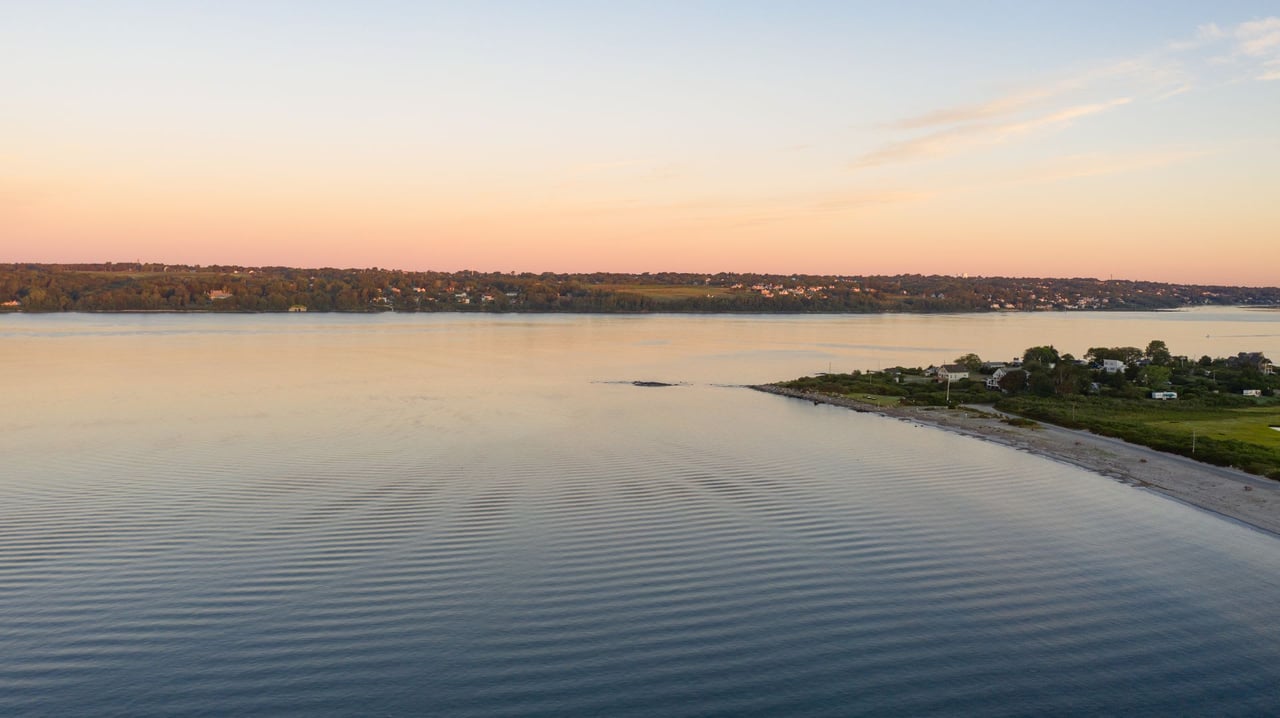
Welcome to
93,329 people live in Mount Pleasant, where the median age is 42.4 and the average individual income is $57,582.476. Data provided by the U.S. Census Bureau.
Total Population
Median Age
Population Density
Average individual Income
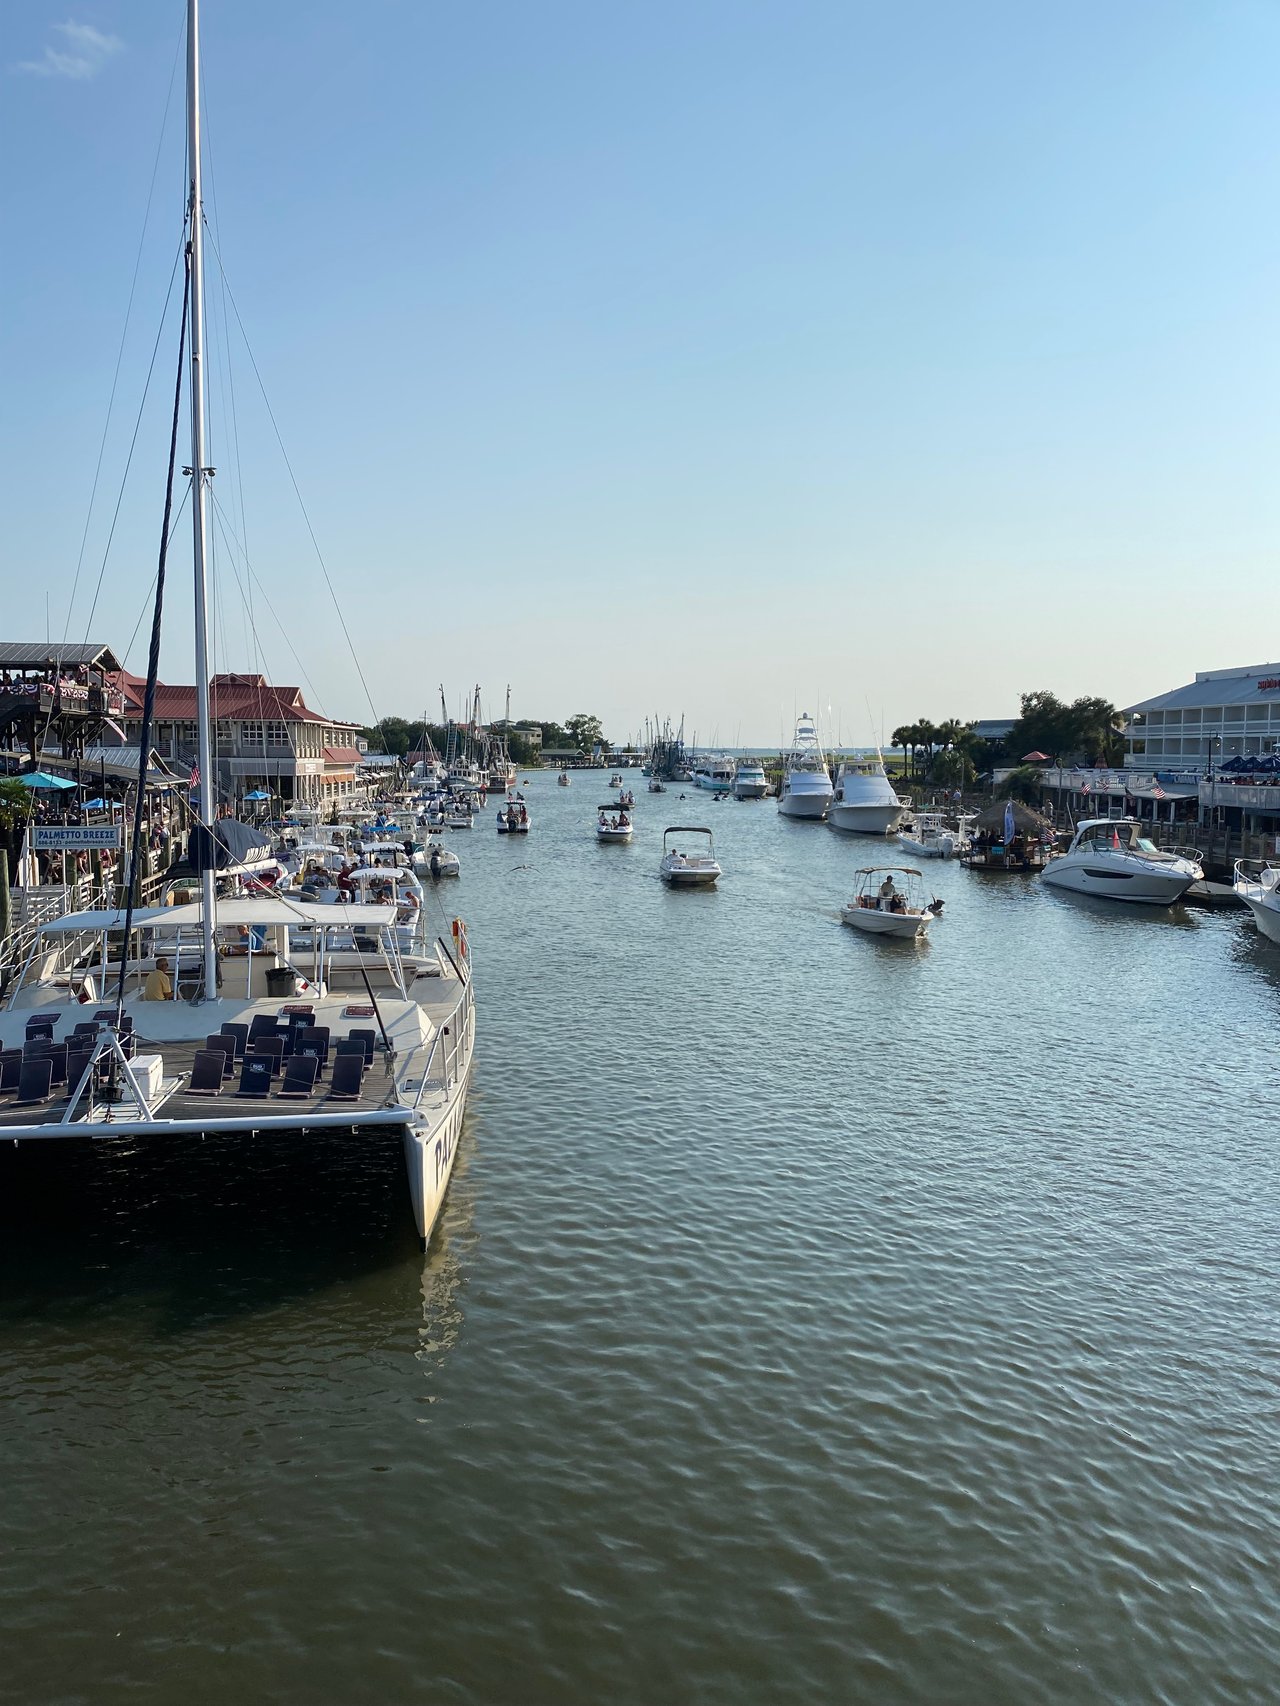
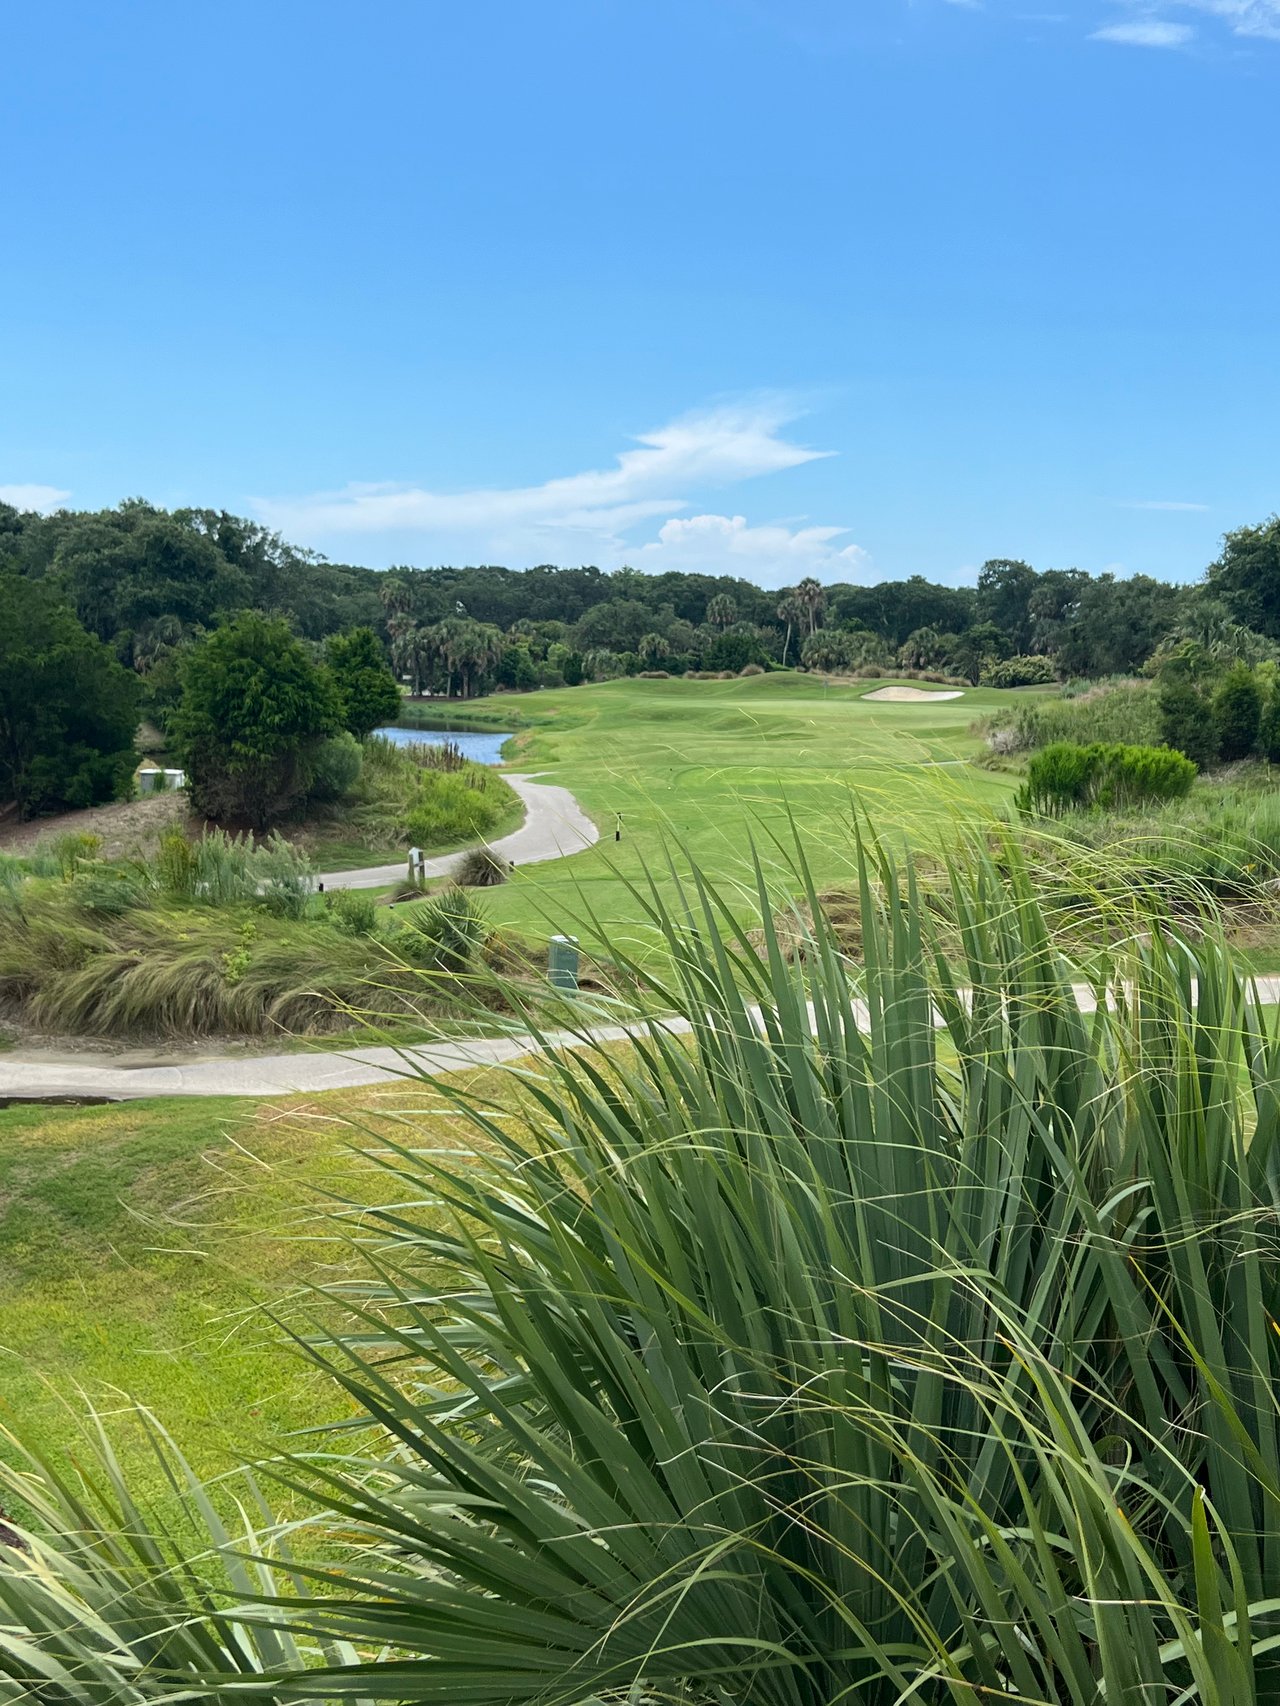
There's plenty to do around Mount Pleasant, including shopping, dining, nightlife, parks, and more. Data provided by Walk Score and Yelp.
Explore popular things to do in the area, including Force Kite and Wake, Charleston Paddle Board Company, and Force Kite and Wake.
| Name | Category | Distance | Reviews |
Ratings by
Yelp
|
|---|---|---|---|---|
| Shopping | 4.14 miles | 26 reviews | 5/5 stars | |
| Active | 4.63 miles | 5 reviews | 5/5 stars | |
| Active | 3.68 miles | 5 reviews | 5/5 stars | |
| Active | 3.95 miles | 5 reviews | 5/5 stars | |
| Active | 3.36 miles | 7 reviews | 5/5 stars | |
| Active | 4.79 miles | 19 reviews | 5/5 stars | |
| Beauty | 4.01 miles | 5 reviews | 5/5 stars | |
| Beauty | 2.8 miles | 6 reviews | 5/5 stars | |
| Beauty | 4.26 miles | 5 reviews | 5/5 stars | |
| Beauty | 3.9 miles | 7 reviews | 5/5 stars | |
| Beauty | 3.76 miles | 6 reviews | 5/5 stars | |
|
|
||||
|
|
||||
|
|
||||
|
|
||||
|
|
||||
|
|
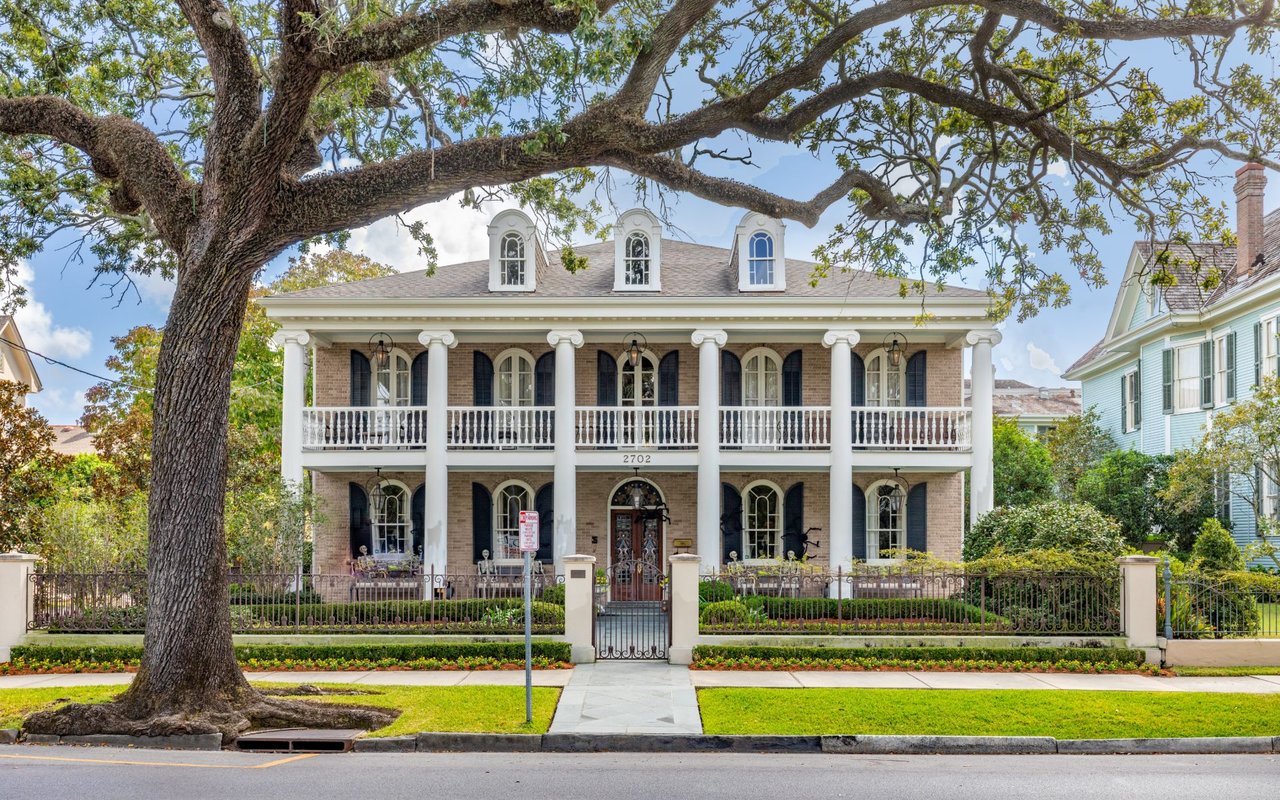
Mount Pleasant has 38,339 households, with an average household size of 4.96. Data provided by the U.S. Census Bureau. Here’s what the people living in Mount Pleasant do for work — and how long it takes them to get there. Data provided by the U.S. Census Bureau. 93,329 people call Mount Pleasant home. The population density is 1,587.79 and the largest age group is between 25 and 64 years old. Data provided by the U.S. Census Bureau.
Total Population
Population Density Population Density This is the number of people per square mile in a neighborhood.
Median Age
Men vs Women
Population by Age Group
0-9 Years
10-17 Years
18-24 Years
25-64 Years
65-74 Years
75+ Years
Education Level
Total Households
Average Household Size
Average individual Income
Households with Children
With Children: 11,620 (30%)
Without Children: 26,719 (70%)
Blue vs White Collar Workers
Blue Collar: 5%
White Collar: 95%

191 Rutledge Ave Charleston SC 29403
191 Rutledge Ave Charleston SC 29403
